
Browse built-in commercial feed charts or create custom week-by-week feeding schedules using fertilizers and blends from your library.
Feed Charts
Feed Charts are structured feeding schedules that define what nutrients your plants receive each week, at what dose, and within what EC and pH ranges. They are the bridge between your fertilizer library and your active cultivation cycles.
Hydrogene Pro includes a built-in library of commercial feed charts, and lets you create fully custom schedules from scratch.
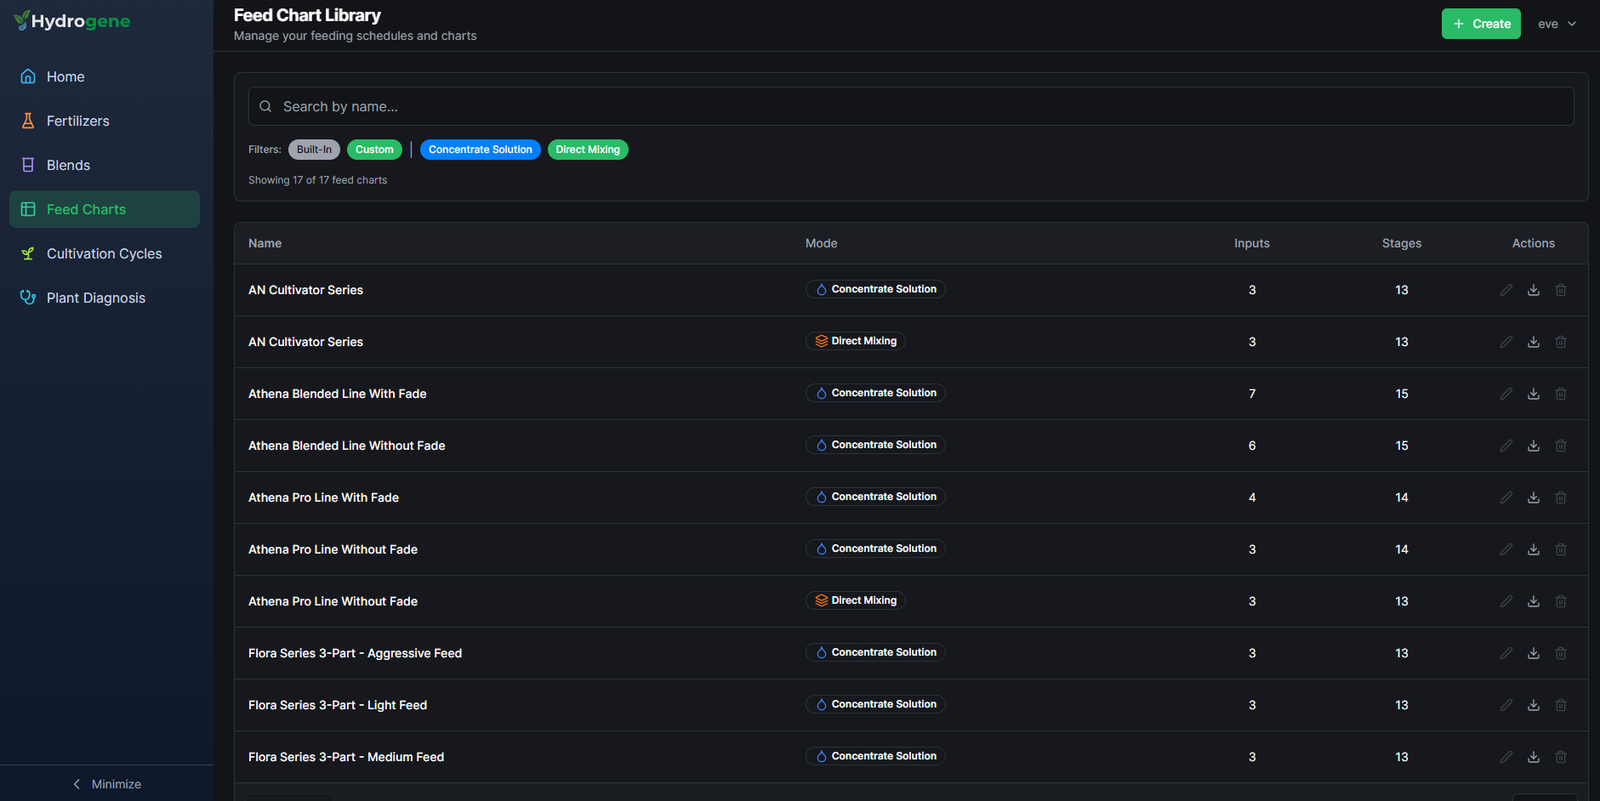
Feed Chart Library
In the Feed Charts tab, several built-in commercial feed charts are available in both Concentrate Solution and Direct Mixing modes. Each one contains fertilizer information for each stage of cultivation.
Clicking a feed chart name displays detailed information about its weeks, stages, and parts.
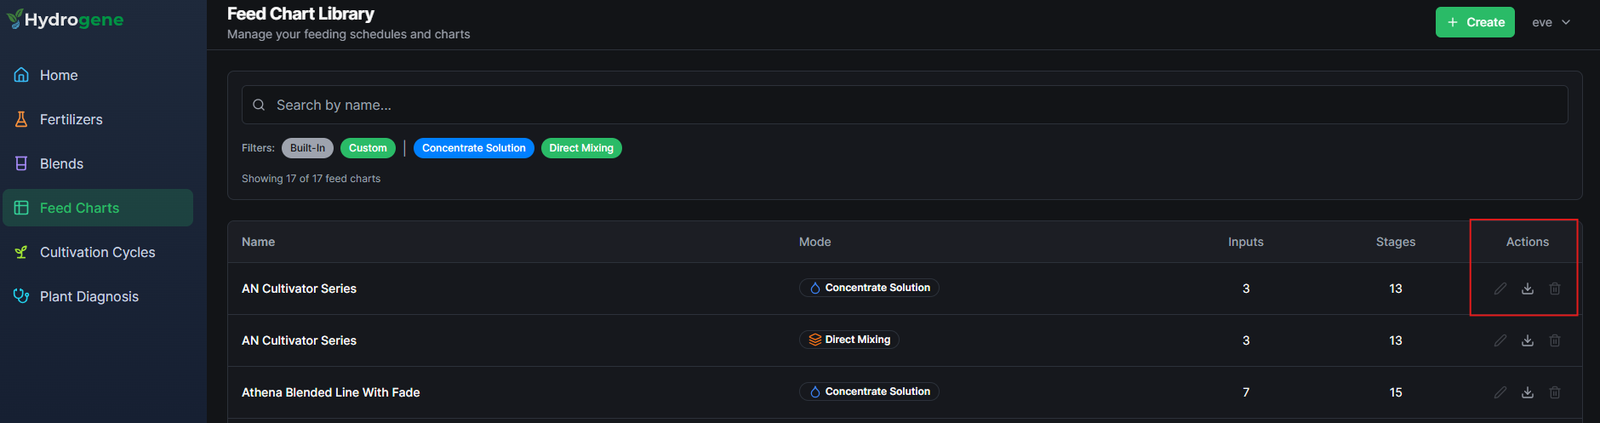
You can download the Feed Chart via Actions. The PDF contains the complete information for each cultivation stage.
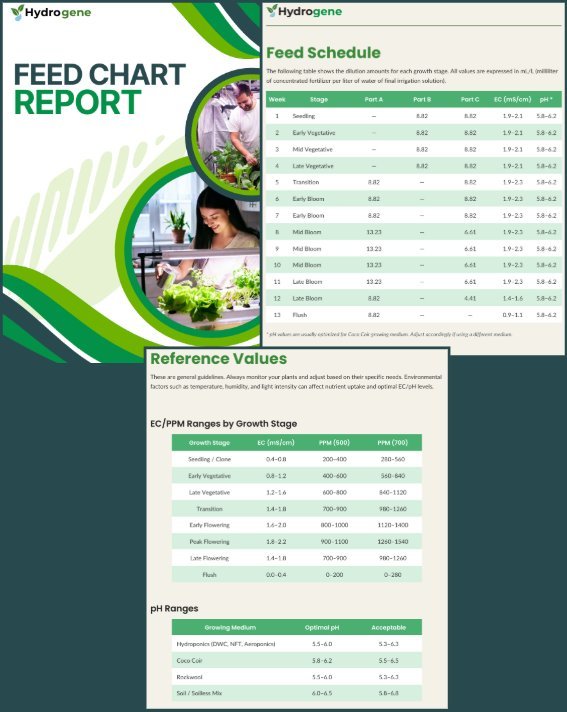
Creating a Custom Feed Chart
To create a Feed Chart from scratch, follow the steps below.
Step 1 — Mode
- In the Feed Charts tab, click the Create button.
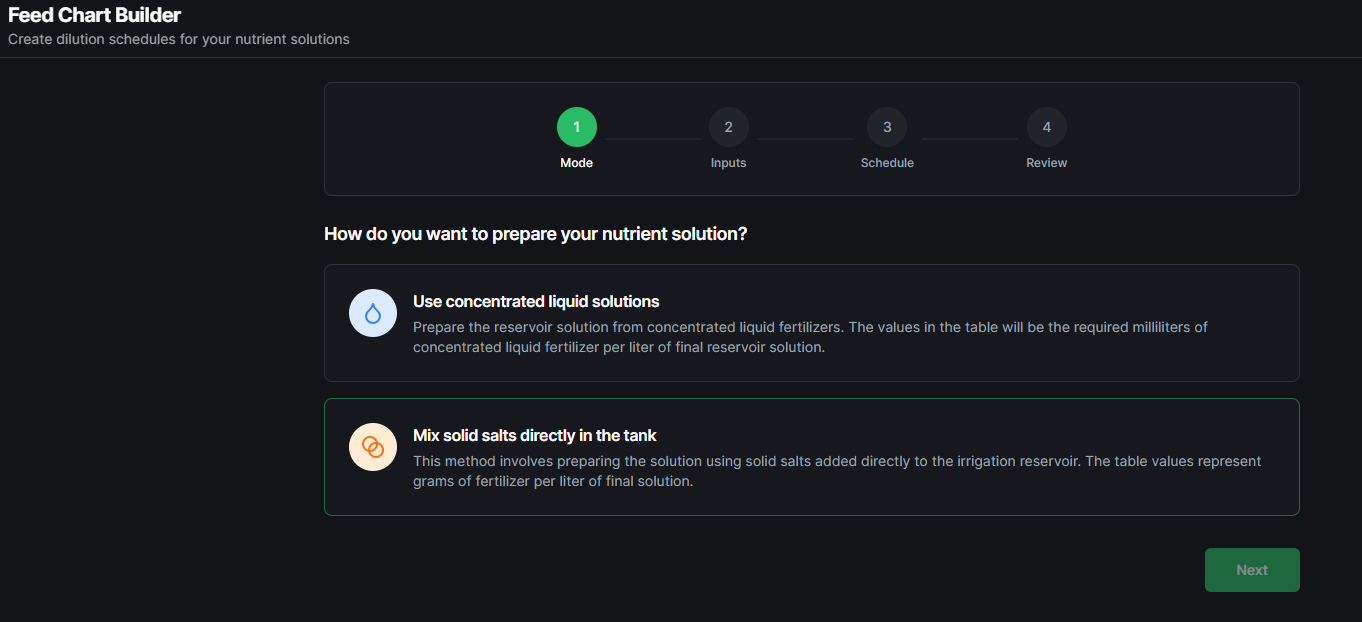
- In step 1 (Mode), choose how you want to prepare your nutrient solution:
- Use concentrated liquid solutions — prepare the reservoir solution from concentrated liquid fertilizers. Values in the table will be the required milliliters of concentrated liquid fertilizer per liter of final reservoir solution.
- Mix solid salts directly in the tank — prepare the solution using solid salts added directly to the irrigation reservoir. Table values represent grams of fertilizer per liter of final solution.
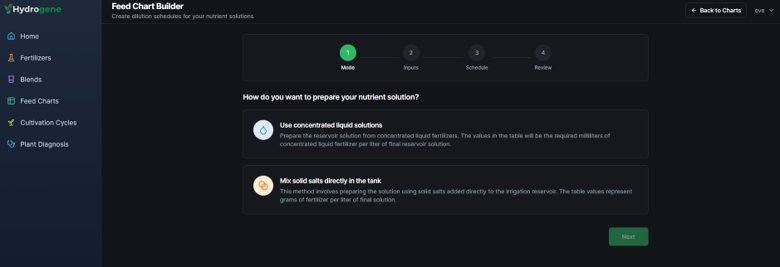
The steps for each option are detailed below.
Concentrate Solution Mode
For concentrated liquid solutions, follow these steps:
Step 2 — Input
- Select the first option and click Next.
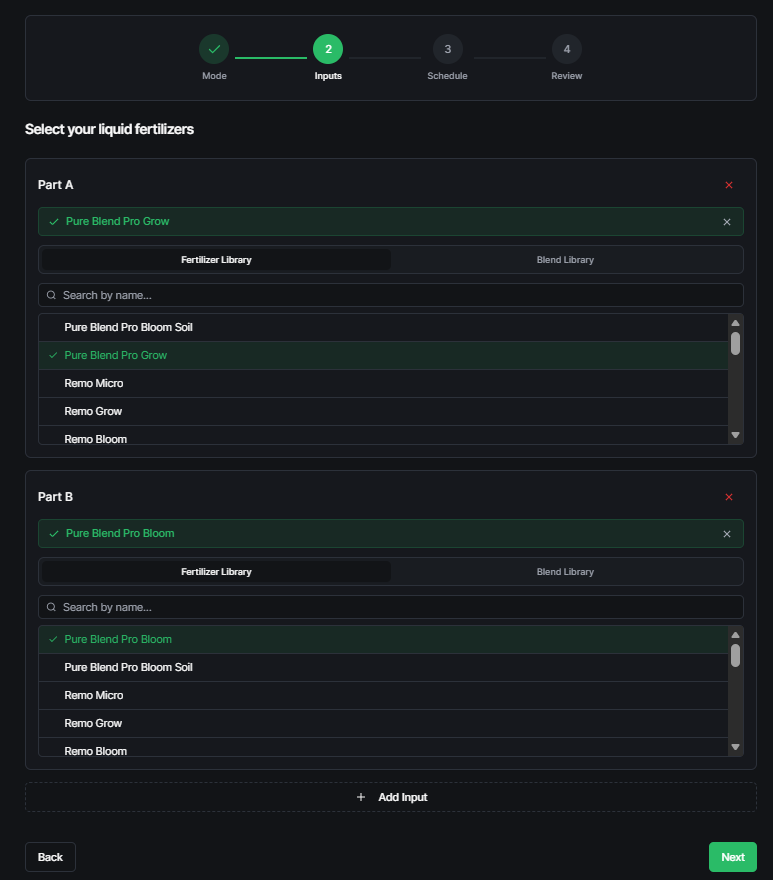
- In step 2 (Input), add the desired fertilizer parts from the Fertilizer Library or the Blends Library.
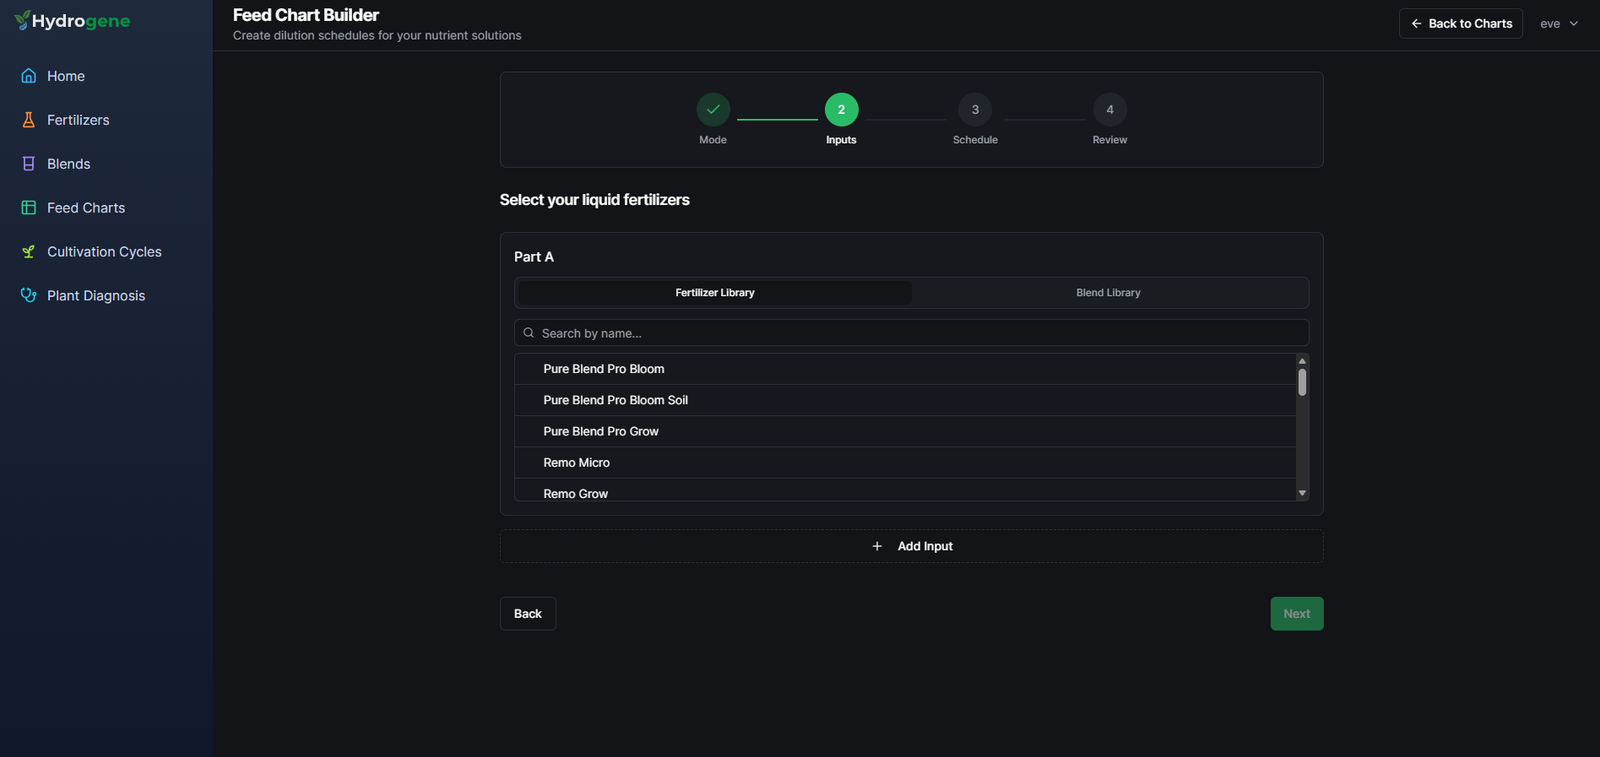
Example: The Pure Blend Pro Grow will be used as Part A and Pure Blend Pro Bloom as Part B. You can add as many parts as needed.
Step 3 — Schedule
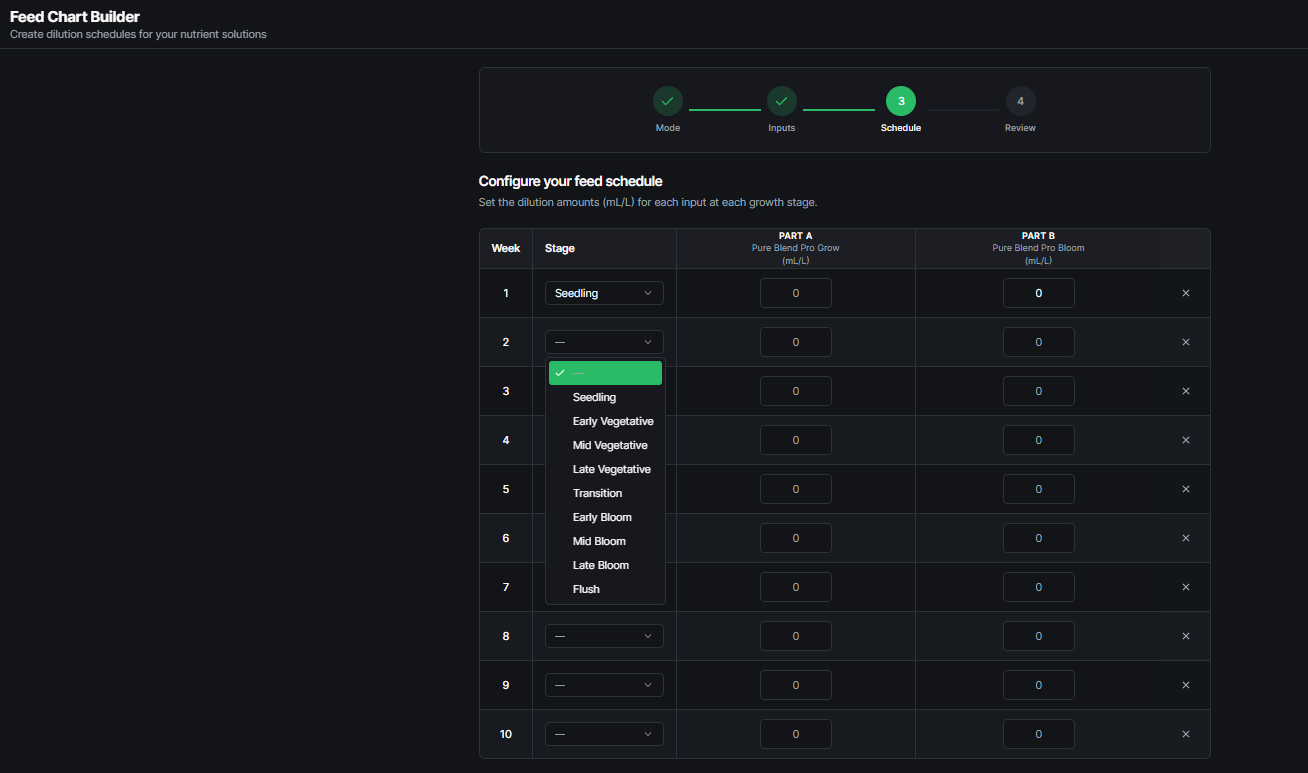
- Click Next and fill in the stages and quantities for the Feed Chart in step 3 (Schedule).
- Enter all information for the stages and selected parts.
- Review and adjust, if necessary, the target EC and pH values.
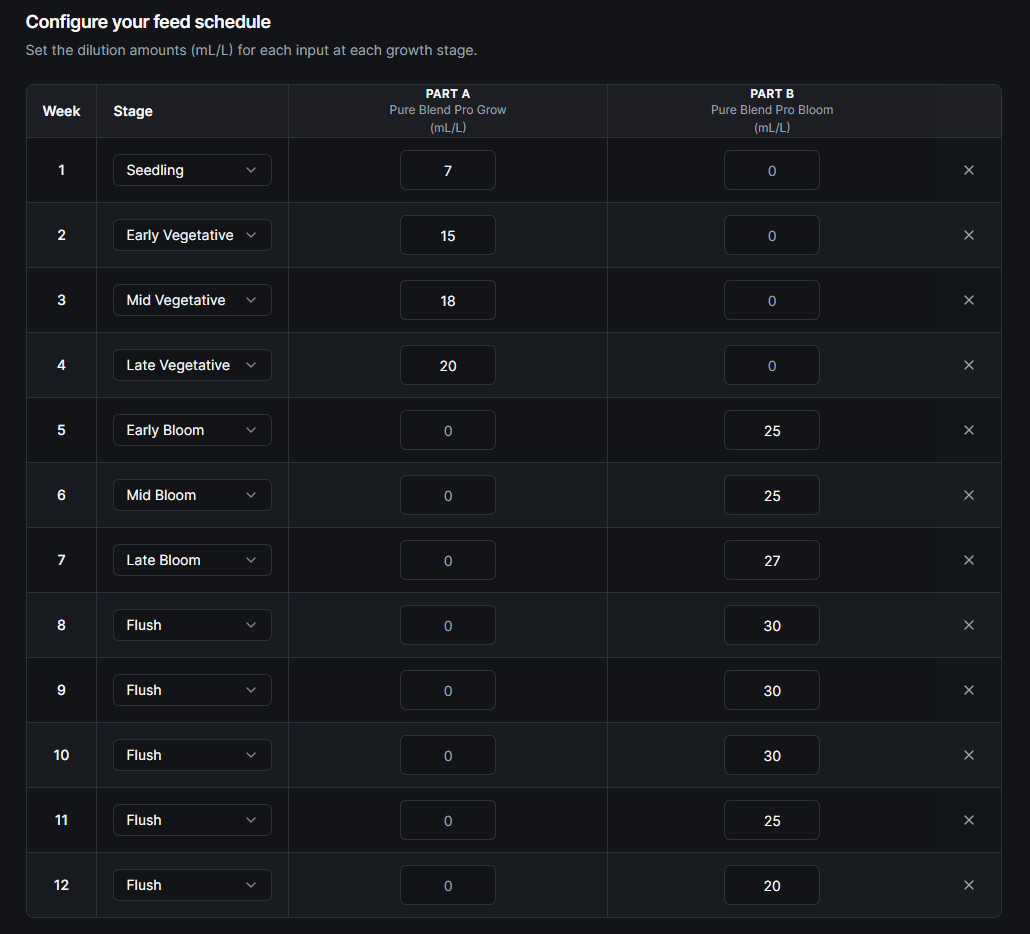
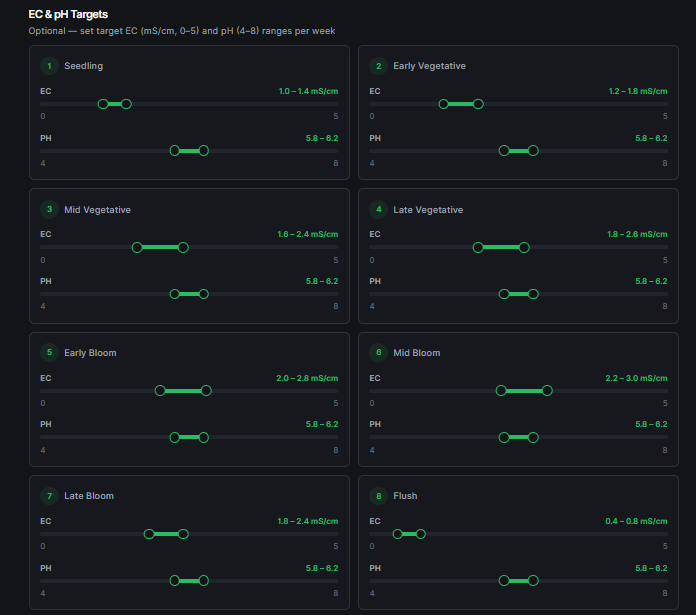

You can add more cultivation weeks using the +Week button at the bottom of the page.
- Click Next.
Step 4 — Review
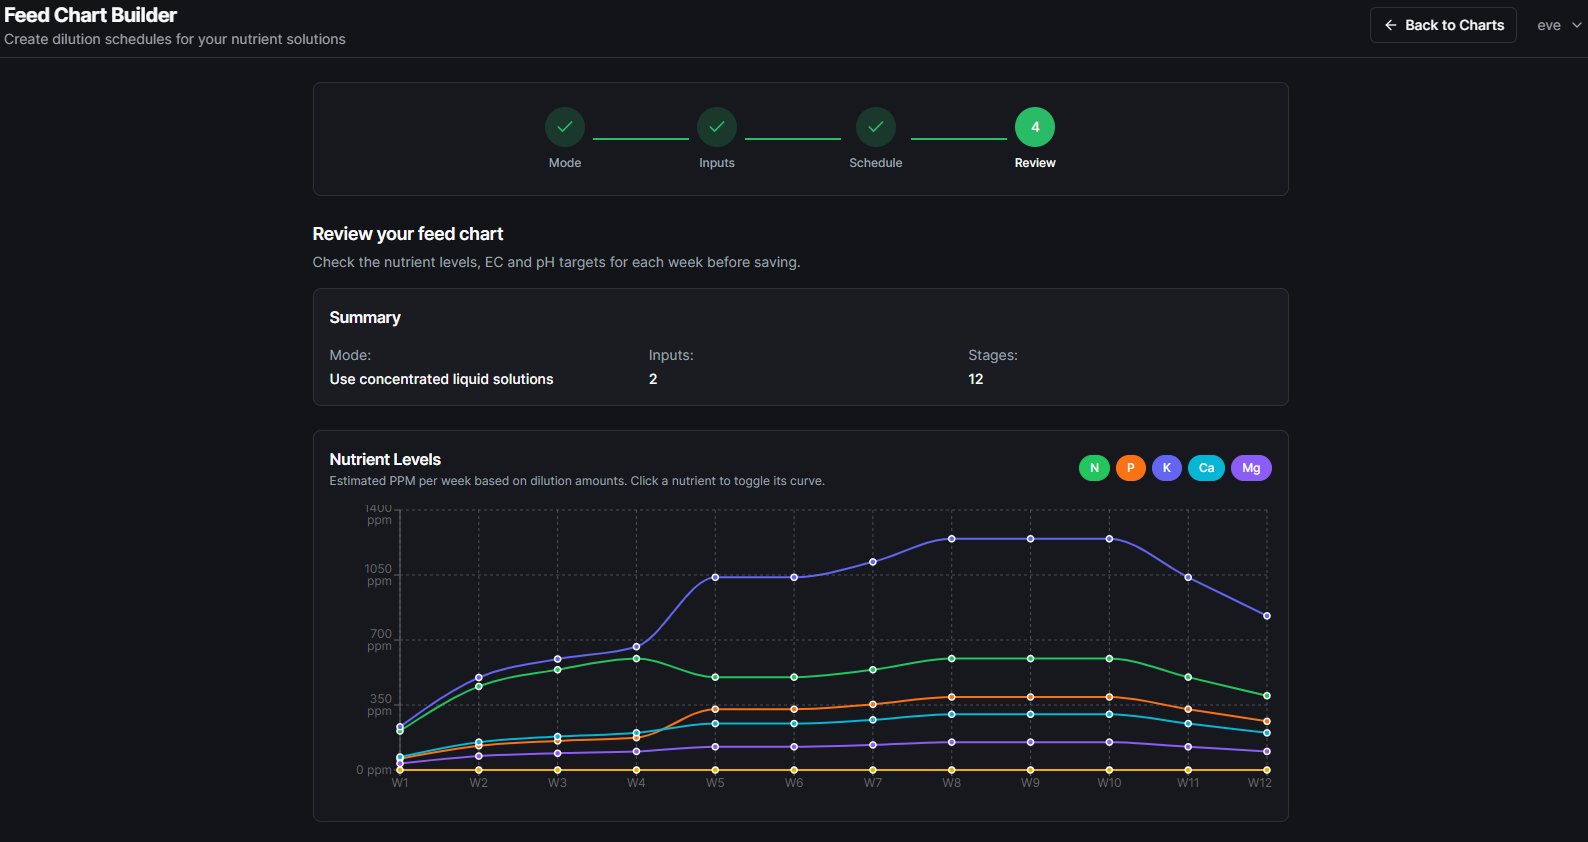
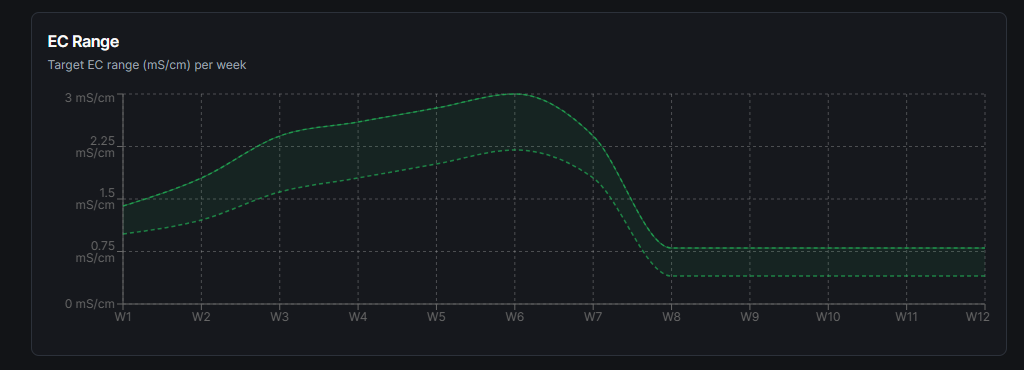
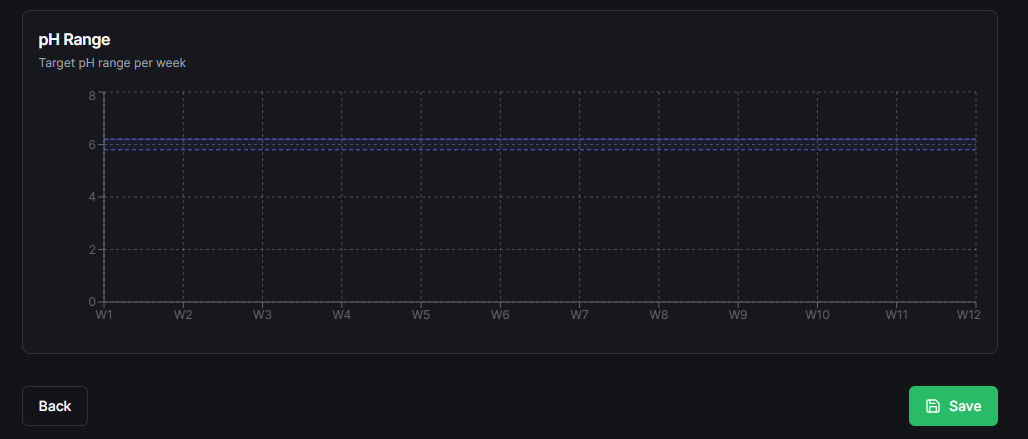
- In step 4 (Review), verify the three progression charts:
Step 5 — Save
- Click Save.
- Enter the Feed Chart name and description in the corresponding fields.
- Nutrient Levels — nutrient ppm levels across the Feed Chart weeks.
- EC Range — EC target ranges across all cultivation weeks.
- pH Range — pH target ranges across all cultivation weeks.
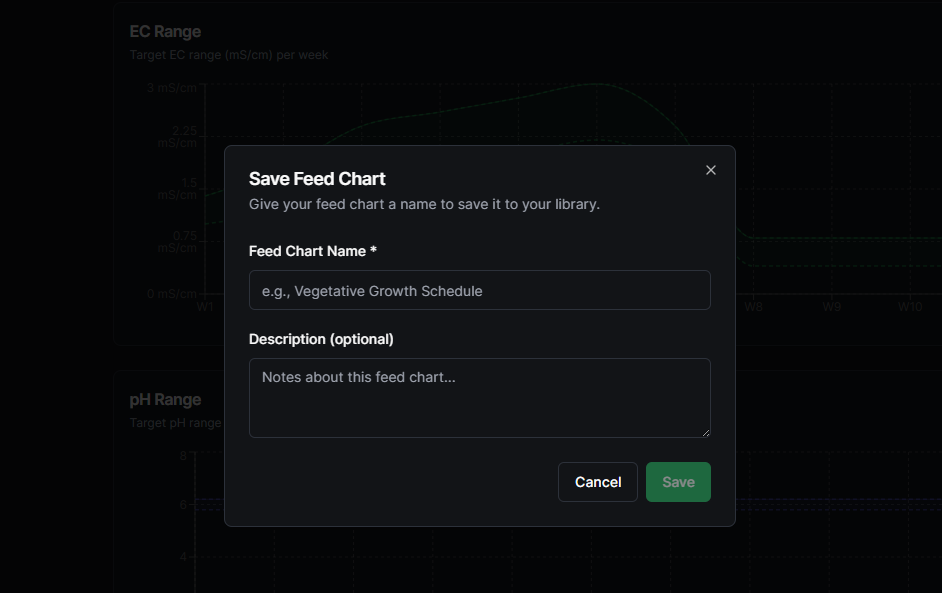
The Feed Chart will be saved as Custom in the library. To view only custom Feed Charts, uncheck the Built-in option in the filters.
Direct Mixing Mode
For direct salt mixing in the tank, follow these steps:
Step 1 — Mode
- In step 1 (Mode), select the second option and click Next.
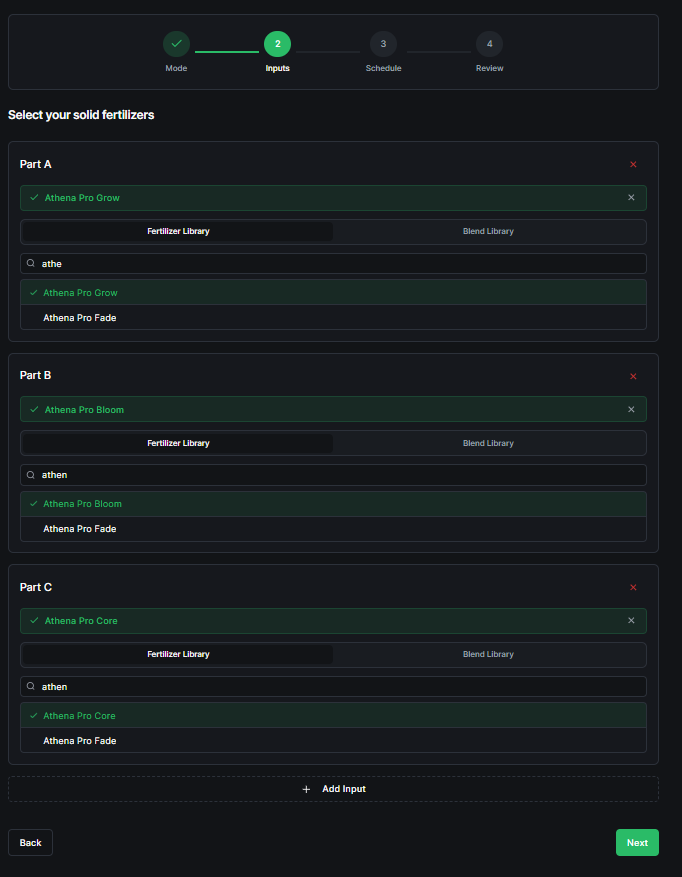
Step 2 — Input
- Select the desired fertilizers to make up the parts. You can add as many as needed.
Step 3 — Schedule
- In step 3 (Schedule), add the stage and quantity information for each fertilizer part for each week.
- Fill in the information for each week.
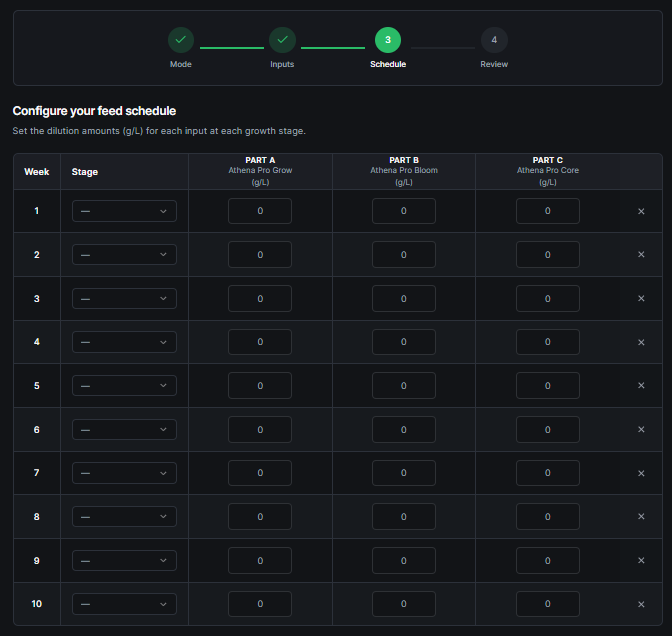
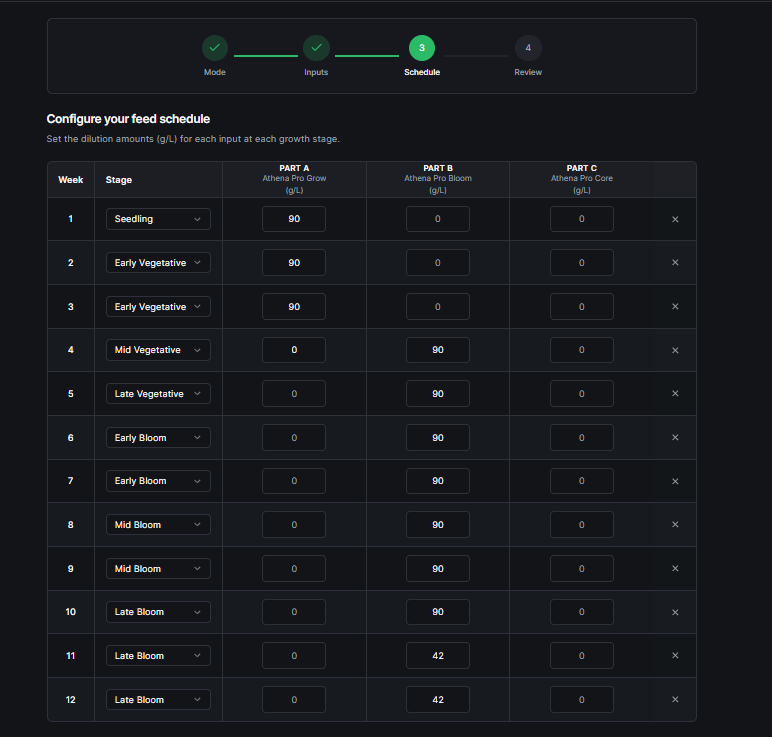
- Review and adjust, if necessary, the EC and pH values for each week.
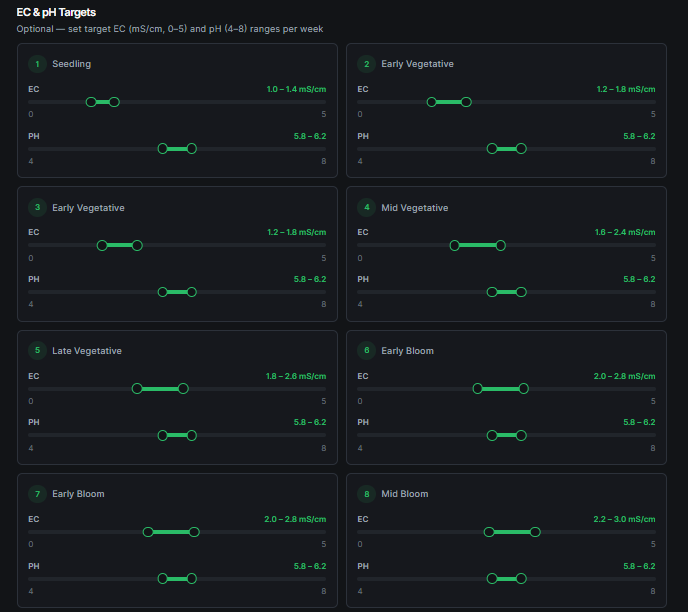
You can add more cultivation weeks using the +Week button at the bottom of the page.
- Click Next.
Step 4 — Review
- In step 4 (Review), verify the three progression charts:
- Nutrient Levels — nutrient ppm levels across the Feed Chart weeks.
- EC Range — EC target ranges across all cultivation weeks.
- pH Range — pH target ranges across all cultivation weeks.
Step 5 — Save
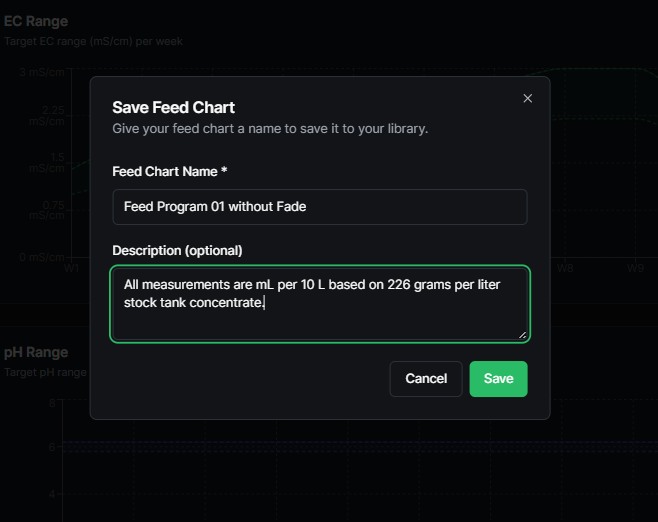
- Click Save.
- Add the Feed Chart name and description in the corresponding fields.
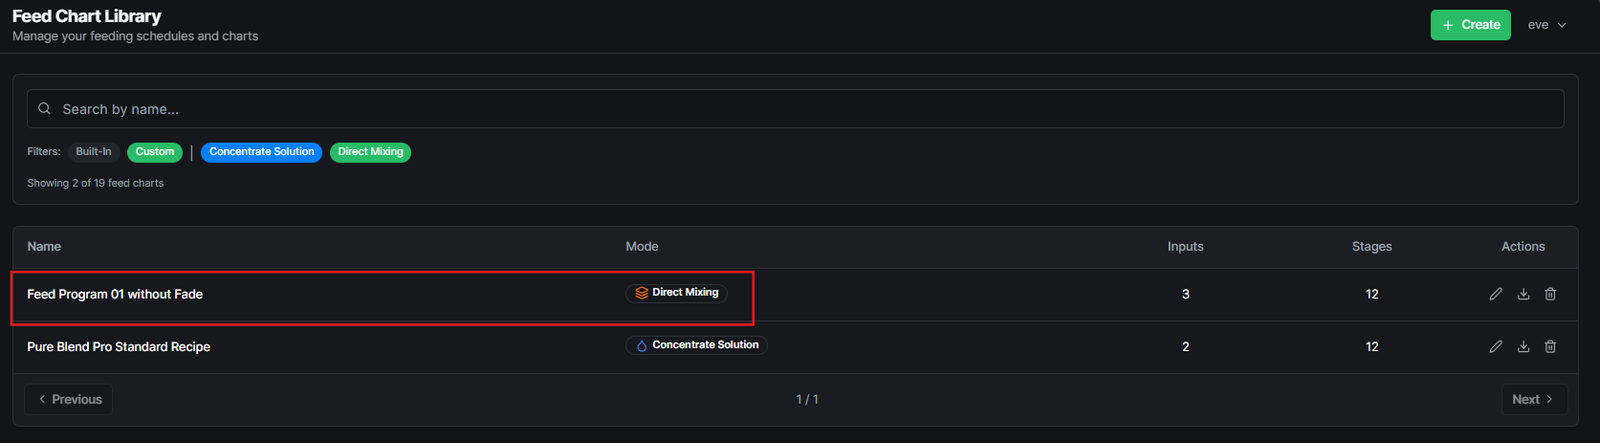
The Feed Chart will be saved as Custom in the Feed Charts library. To view only custom Feed Charts, simply uncheck the Built-in option.
Tips and Best Practices
- Review all three charts before saving. A single stage with incorrect EC can affect plant performance across several weeks.
- Name charts descriptively. Include the mode, crop type, or target strain in the name (e.g., “Tomato — Concentrate — 10wk Veg/Bloom”).
- Use descriptions to capture intent. Explain why you made specific choices — this is useful when referencing the chart months later or sharing it with a team.
- Start from a built-in chart. If a commercial feed chart is close to what you need, study its structure before building your own from scratch.
- Add a flush week. Most crops benefit from a final week with plain water or a low-dose flush solution. Include it in your schedule from the start.
Related Features
- Fertilizer Library — Manage the fertilizers used as parts.
- Blends — Use custom blends as parts in your feed chart.
- Cultivation Cycles — Link a feed chart to an active grow.
- Build a Feed Chart — Step-by-step workflow.